Air Quality Forecasting (LSTM)
A recurrent next-hour forecaster for an hourly air-quality pollutant series, inspired by the UCI Air Quality dataset. It predicts the next hour’s pollutant concentration from the current hour.
How it works
- Q16.16 fixed-point LSTM, 1 input → one hidden LSTM layer of 16 tanh neurons → 1 sigmoid output, with
GradientClipByValuefor recurrent stability and learning rate 0.5. - Demonstrates TinyMind’s
LstmNeuralNetwork<>recurrent training and inference entirely inQValuefixed-point on a long time-series — a step up from thelstm_sinusoidtoy, on a signal that looks like a real sensor stream. - 15,000 epochs over sequential pairs
series[t] -> series[t+1], with the recurrent state reset every 24 hours so each BPTT segment is a clean one-day stretch — this keeps the daily-cycle gradient from washing out over the 2000+ step series and stops the net collapsing to the mean. The model trains on all but the last 200 hours and forecasts those held-out hours one step ahead. - Two details are load-bearing for a tight fit: weights are initialized in [-0.5, 0.5] real units (a raw Q8.8-style init is ~256x too small in Q16.16 and starves training), and the series is normalized into [0.1, 0.9] rather than [0, 1] so the daily peaks and troughs sit inside the sigmoid’s responsive band instead of being clipped at the rails.
Build and run
cd examples/air_quality
make release
make run
make plot      # needs matplotlib; a venv/pyenv works if it is not already in your Python
By default the example runs fully offline on a synthetic hourly series (deterministic, seed 7): a strong 24-hour daily cycle with rush-hour peaks, a gentle multi-day trend, and mild noise (~100 days of a CO-like concentration). To use the real UCI data, drop AirQualityUCI.csv into ./output/ — the loader auto-detects it, reads the CO(GT) column, handles the ; separator and decimal comma, and skips the -200 missing markers, falling back to the synthetic series if too few valid samples are found.
Output
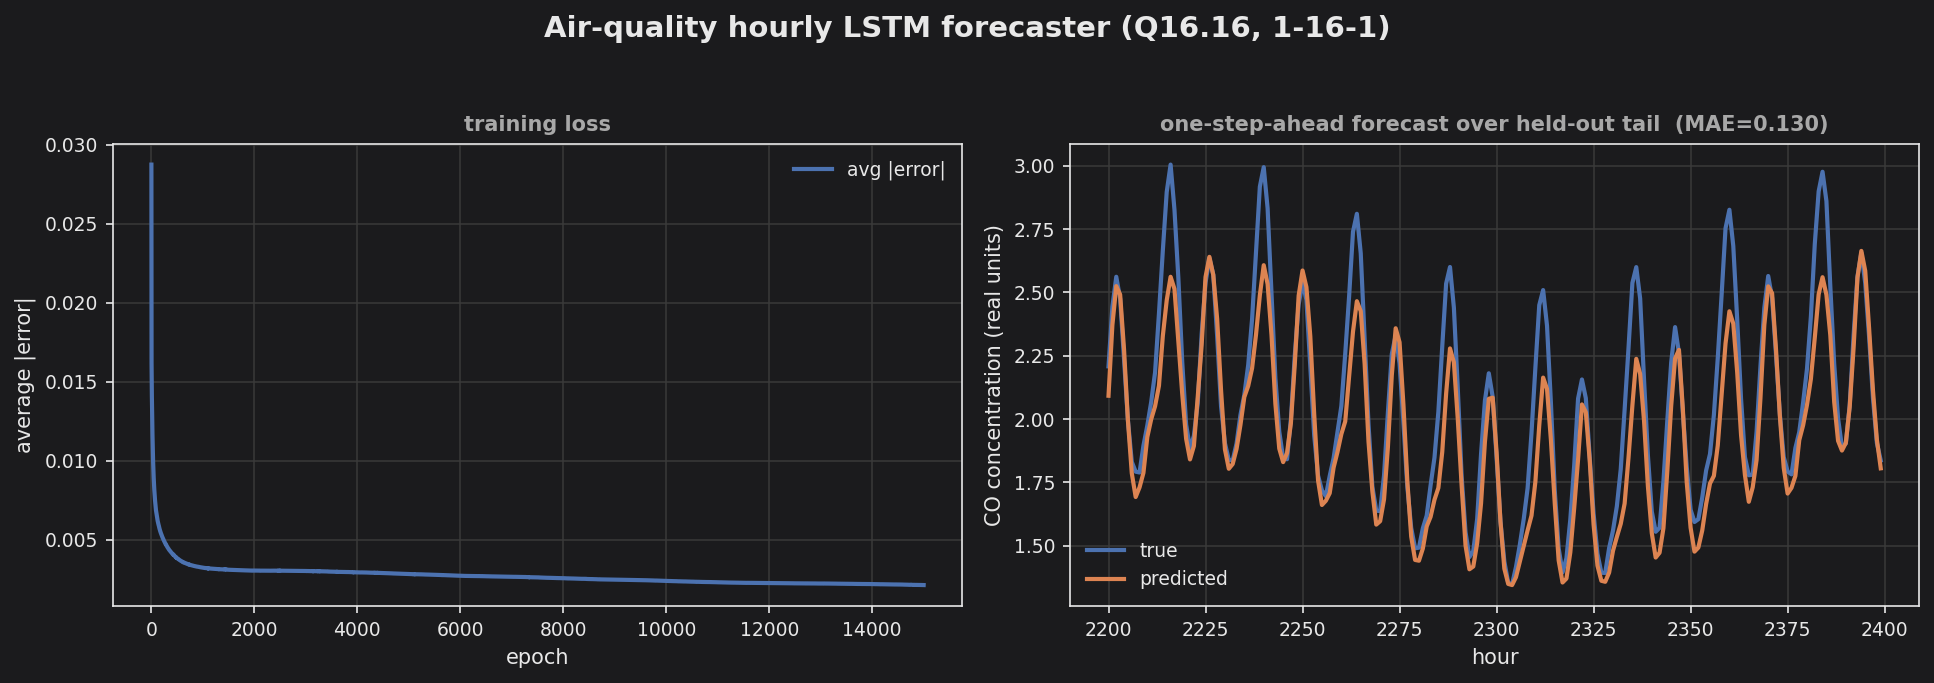
The loss converges within ~2000 epochs and the predicted line tracks the daily rise-and-fall of the true series closely, hitting the rush-hour peaks and overnight troughs (the very tallest peaks are shaved slightly — the residual cost of one-step prediction from a single scalar). The one-step-ahead MAE is around 0.13 in concentration units over a series spanning roughly 1.3–3.0 — half the error of the earlier under-trained, rail-clipped build.