Gas Sensor Array Drift
A six-way gas classifier that demonstrates sensor drift — the slow accuracy decay a fixed model suffers as metal-oxide gas sensors age — inspired by the UCI Gas Sensor Array Drift Dataset (16 chemo-resistive sensors × 8 features, recorded over 36 months in 10 batches).
How it works
- Q16.16 fixed-point MLP, 128 → 32 → 6, ReLU hidden layer and 6 sigmoid outputs (one-hot, predicted class is the argmax).
- The same
NeuralNet<>fixed-point train-and-deploy path as Iris, scaled up to a 128-input classification task, used to make sensor drift visible as a drift curve: train once on batch 1, then evaluate every later batch. - The 128 inputs are z-score normalized using batch-1 statistics, which are then applied unchanged to every batch — normalization deliberately does not compensate for drift, which is the point. Each later batch applies a per-sensor-feature multiplicative gain and additive offset growing with the batch index, a documented stand-in for sensor aging.
Build and run
cd examples/gas_sensor_drift
make release
make run
make plot      # needs matplotlib; a venv/pyenv works if it is not already in your Python
The dataset is synthetic (deterministic, seed 7; 6 gas classes with distinct 128-dim mean response vectors, 150 samples/class/batch over 10 batches), so there is no file to copy — make run cds into ./output/ and runs the binary directly.
Output
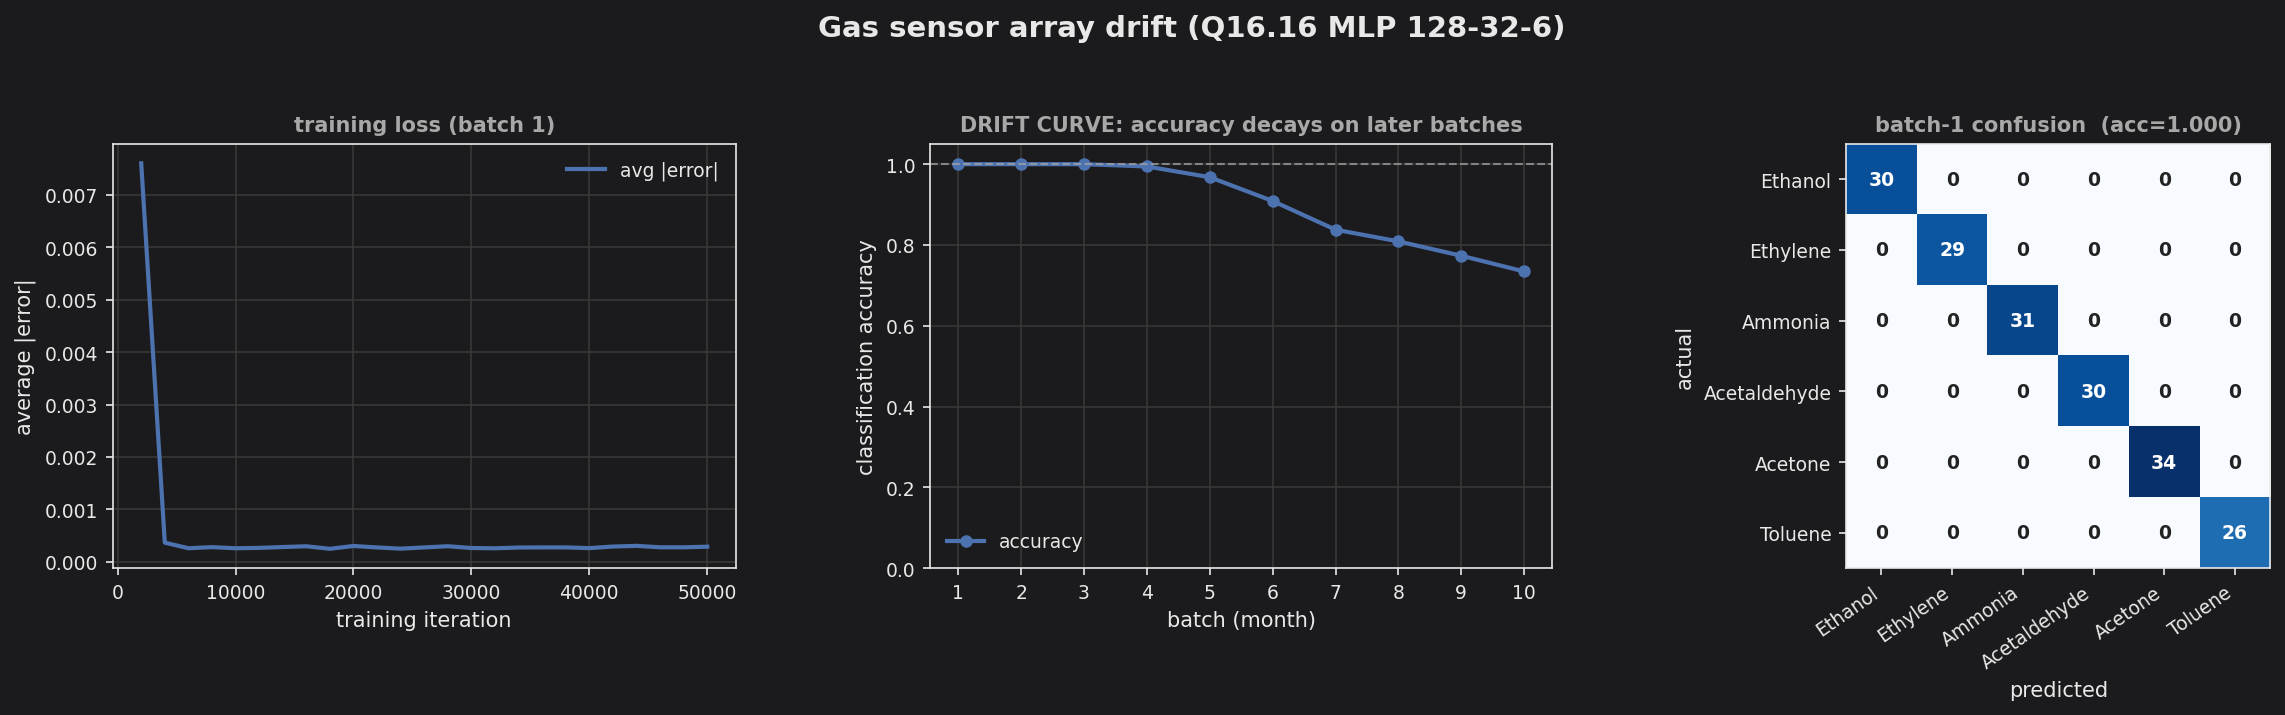
Batch 1 trains to a perfectly diagonal in-distribution confusion matrix (batch-1 accuracy 1.00), but the drift curve slopes clearly downward as the batch index grows — accuracy falls from ~1.0 on the early batches to ~0.73 by batch 10. The gases are identical throughout; only the sensor response distribution has moved, which is exactly the failure mode the dataset was created to study.