Energy Efficiency Regression
A two-output building energy-load regressor trained on the UCI Energy Efficiency dataset, predicting the heating and cooling load of a building from its design geometry.
How it works
- Q16.16 fixed-point MLP, 8 → 16 → 2, ReLU hidden layer and 2 linear outputs (Y1 = heating load, Y2 = cooling load).
- TinyMind’s smallest end-to-end regression example — the linear-output counterpart to the sigmoid/argmax classifier in Iris. It exercises
LinearActivationPolicyplusGradientClipByValue(clamp to [-1, 1]) with momentum and acceleration disabled, the combination a fixed-point linear head needs to stay stable. - The 8 design features are z-score normalized then scaled by 1/3; the two targets are standardized to z-score (scaled by 1/6) for training and de-standardized back to real load units for reporting. 40k iterations of uniform sampling from the 80% training split.
Build and run
cd examples/energy_efficiency
make release
make run
make plot      # needs matplotlib; a venv/pyenv works if it is not already in your Python
The full 768-row dataset (~35 KB) ships with the example as ENB2012_data.csv; the Makefile copies it into ./output/ before the run, so there is nothing to download.
Output
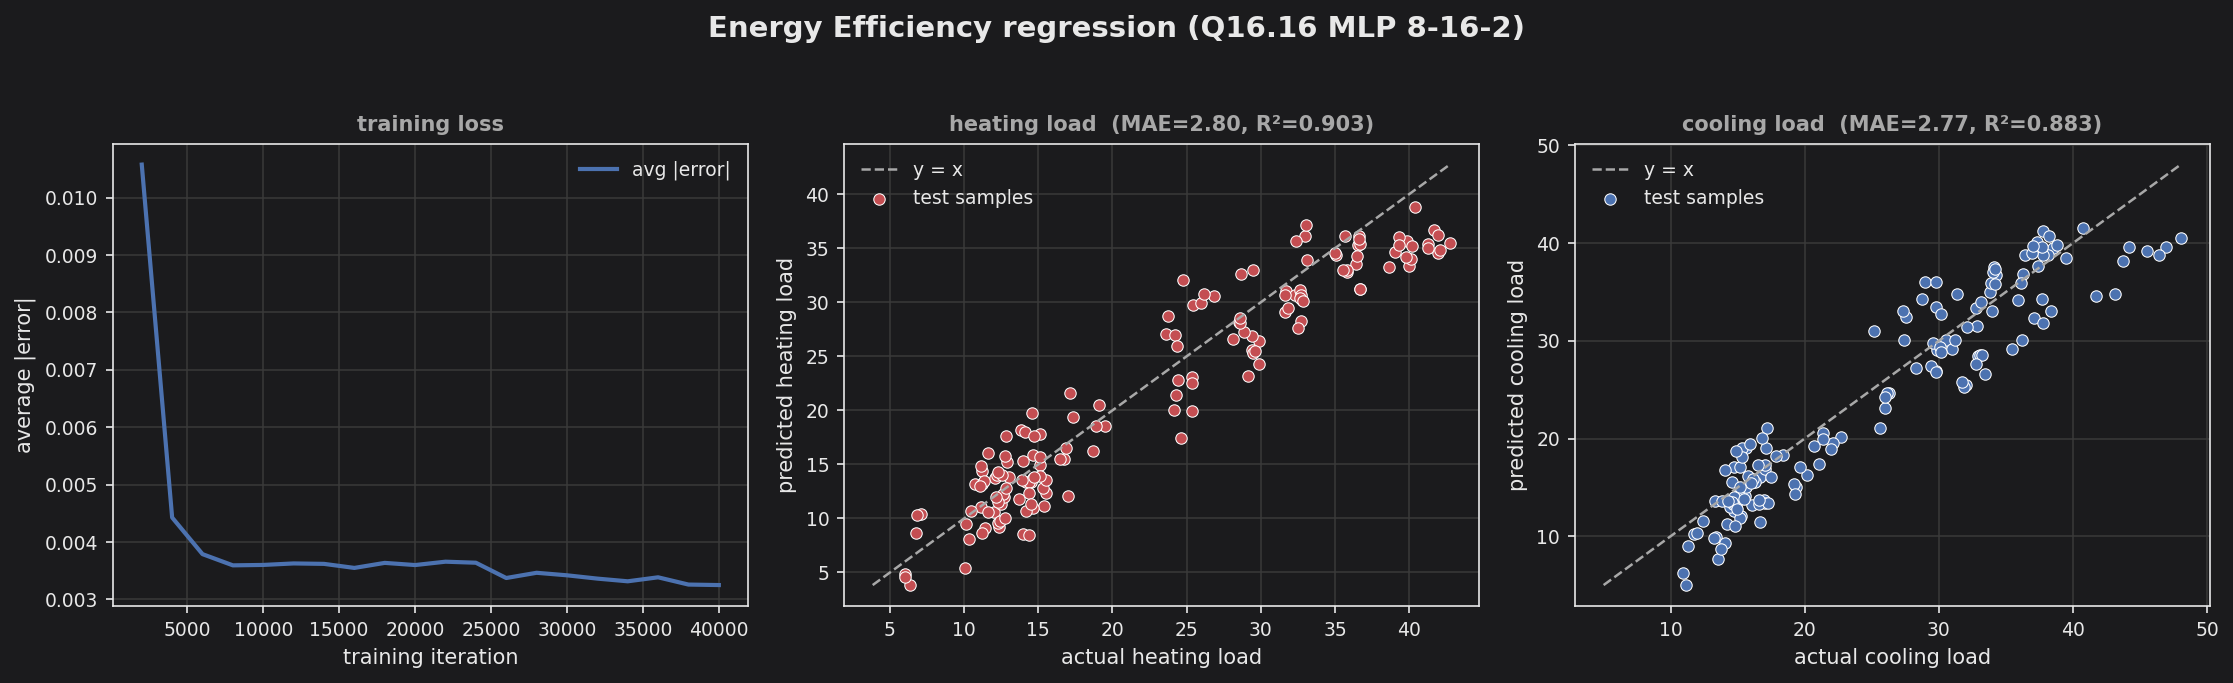
The loss falls quickly in the standardized target domain, and both predicted-vs-actual scatters hug the y=x reference line. The fixed-point MLP tracks the held-out split closely: heating-load R² ≈ 0.90 (MAE ≈ 2.8) and cooling-load R² ≈ 0.88 (MAE ≈ 2.8), both loads being highly predictable from building geometry.