Predictive Maintenance (AI4I 2020)
A binary machine-failure classifier trained on the AI4I 2020 Predictive Maintenance Dataset, predicting whether a milling-machine reading represents an imminent failure.
How it works
- Q16.16 fixed-point MLP, 10 → 24 → 1, ReLU hidden layer and a single sigmoid output (threshold 0.5 for the failure decision).
- Demonstrates the TinyMind
NeuralNet<>feed-forward MLP trained and run end to end inQValuefixed-point — the train-and-deploy-on-an-MCU path applied to imbalanced binary classification. - Inputs are the 5 process features (air temp, process temp, rpm, torque, tool wear), 3 physics-derived product features (power ≈ rpm·torque, overstrain ≈ toolwear·torque, temperature gap), and a 2-dim one-hot for the product variant; all numeric inputs are z-score normalized then scaled by 1/3. Because real failures are only ~3.4% of the data, training uses 50/50 balanced sampling so the net cannot collapse to the trivial majority classifier.
- Why the product features: the AI4I failure modes are products of inputs (mechanical power drives PWF, tool-wear × torque drives OSF). A small ReLU MLP cannot synthesize a multiplication from raw features alone, so handing it those terms directly is the single biggest lever — it lifts precision from ~0.55 to ~0.80 (F1 0.68 → 0.84) without sacrificing recall.
Build and run
cd examples/predictive_maintenance
make release
make run
make plot      # needs matplotlib; a venv/pyenv works if it is not already in your Python
If ai4i2020.csv is present in the run directory (make run cds into ./output/) it is loaded directly; otherwise the program synthesizes 10,000 rows following the documented AI4I 2020 generative and failure-labelling rules (HDF, PWF, OSF, TWF, RNF), so the example trains end to end with no download. To use the real data, download ai4i2020.csv from the UCI page above and cp it into ./output/ before make run.
Output
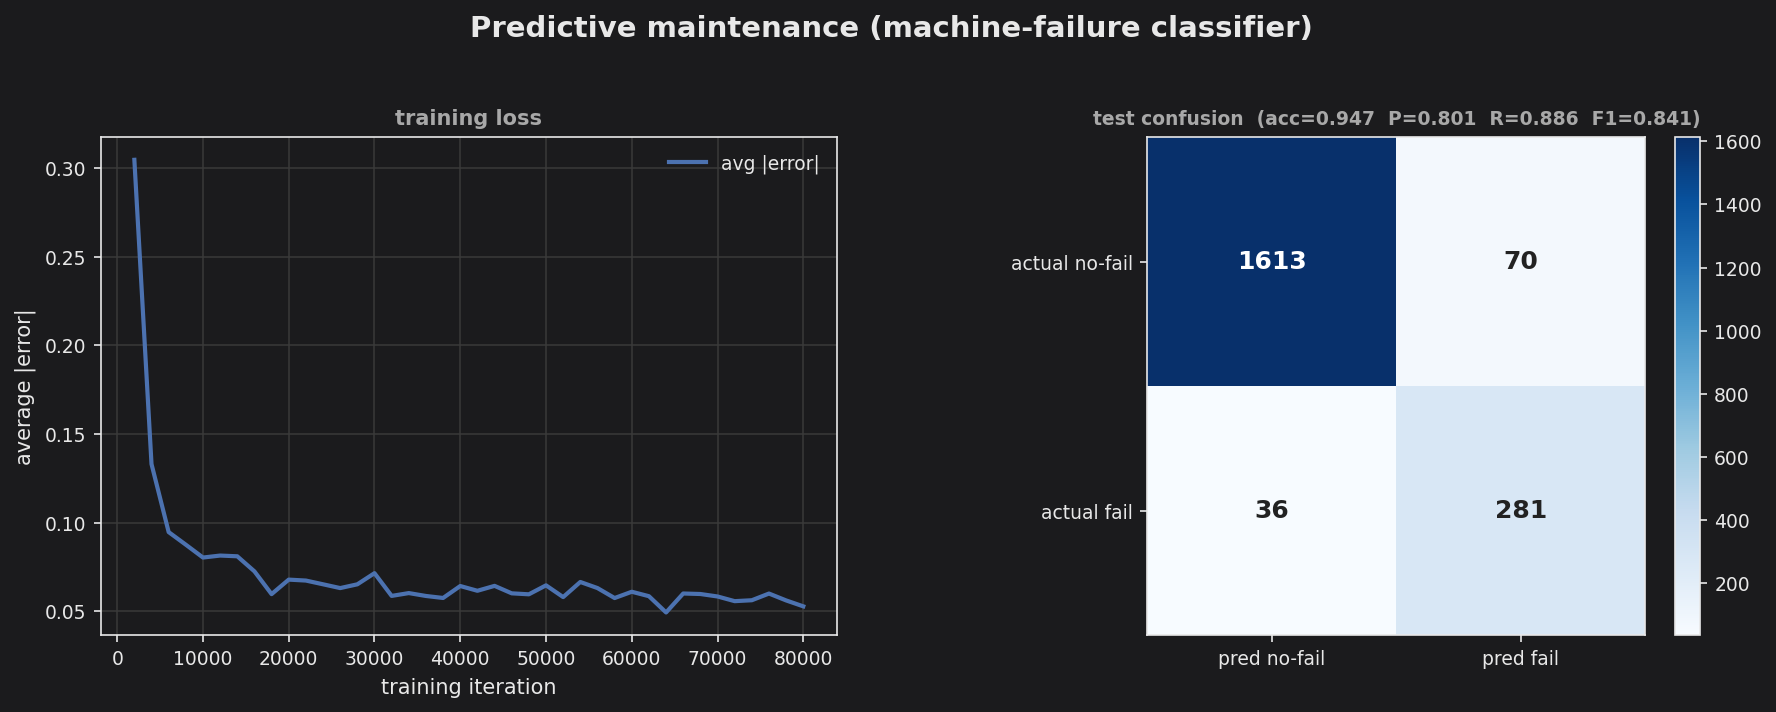
The loss curve converges to ~0.05 average error. The confusion matrix shows the payoff of the product features plus balanced sampling: of 317 true failures, 281 are caught (recall ~0.89) while false alarms stay low (precision ~0.80), for an overall test accuracy of ~0.95 and an F1 of ~0.84. The model still leans toward catching failures over avoiding false alarms — the right trade-off for maintenance — but no longer at the cost of swamping operators with false positives.